Market scan is an invaluable
tool from which much information can be taken to identify where the action
is occurring in the stock market.
The Market Scan page is divided
into section for ease of use. These sections are explained below.
|
Market Status
|
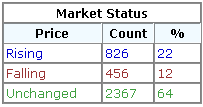
This shows an overview of how
many shares are rising, falling or remain unchanged. This is shown in a box
at the top of the Market Scan page.
|
|
As you can see in this
example 826 (22%) of shares have seen a rise in price on this day.
456 (12%) are falling and 2367
(64%) remain unchanged.
|
Gainers and Losers
|
|
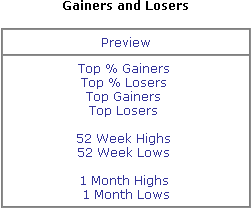
This area of the Market Scan
page has several different section as shown above. By clicking on the title
you want you will receive specific information on that area. For example if
you click on Top % Gainers you will receive a display of just that. Below
is an abbreviated version of this.
|

|
Trade Analysis
|
|
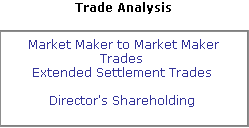
Trade analysis allows you to
access specific information on Market Maker to Market Maker Trades,
Extended Settlement trades and Director’s Dealings, by clicking on the
relevant headings.
|
Bid/Offer Spreads
|
|
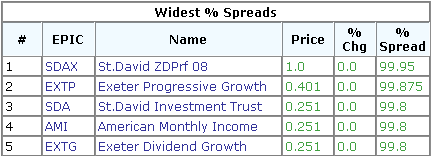
Again by selecting one of the
areas will get information of Widest %
Spreads or Narrowest % Spreads.
Below is an abbreviated example of
the Widest % Spreads Screen.
|
|
Volume Analysis
|

|
Choose to view either volume
leaders or price x volume leaders. Volume leaders shows a list of
company’s listed in order of those who have had the largest amount of
stock dealt in the abbreviated table below VOD are the Volume Leaders due
to the fact that there has been stock movements totaling 185,775,612.
|

|
The price x volume leaders
shows a table of company’s where the current price has been multiplied
by the current volume of shares traded. Below is an abbreviated example of
such a table.
|

|
As you can see from this
example VOD Is at the top. This is due to the fact that it’s price is higher, giving a higher
Price x Vol total.
|
Constant Gainers/Losers
|
|
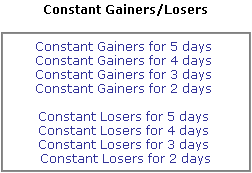
By clicking on any of the
links shown in this box you will be presented with a list of the
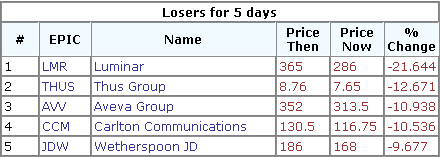
corresponding shares. In the example below by selecting Constant Losers for
5 days we can see that SBRY has dropped 15.337% in the last 5 days.
|
|
This is an invaluable tool to
show you what the trends have been on certain stocks.
|
Fundamentals Analysis
|

|
| This box shows Market
capitalization and Market Cap/Turnover |


