|
The trader's and active investor's buzz word is 'Level II' but is it just another gimmick to make you stump up more each month from your credit card? In truth you can trade without it but the real question is: 'Can you trade successfully?' Level 2 information has been available to investors and traders for many years but it is only in the past few that the price has become affordable for the private investor.
Level II refers to the full depth of information available in the markets. It is split into three stock categories namely SEAQ (Stock Exchange Automated Quotations System), the blue chip SETS (Stock Exchange Electronic Trading Service) and SETSMM.
What is Level 1?
Level I information consists of only the real-time mid/bid/offer quotes for shares trading on the LSE. The data access does not disclose which market makers are bidding or offering stock, and it does not show how many shares they are prepared to deal up to. This offers them an advantage because clients cannot see how the price is derived or what the overall position of the market is in the stock; Level I users are partly blindfolded.
Level 2 SEAQ
This type of quotation system is a step up from the Level I. Level 2 SEAQ provides real-time access to the quotations of individual market makers registered in every LSE SEAQ stock as well as the offering or bidding sizes that they will trade up to. This level of access gives the name of the market makers looking to trade the stock, and allows traders to see which ones are showing the most interest in a stock and identify the patterns for each one.
Market makers provide continuous bid and offer prices for each of the stocks they have on their 'books'. There can be as few as one or as many as 20 (or more) for a particular stock depending on the average daily volume; the more actively traded a stock is, the more attractive it is for them to deal in.
The market makers play an important rose as catalysts, particularly for enhancing stock liquidity and thus generally for promoting long-term growth in the market.
They must maintain this continuous two-sided quote (bid and offer) at normal market size or greater at all times. This ensures that there is a buyer for the sell order and a seller for the buy order at any time.
Let's look at a the Barclays/ MoneyAM Level II SEAQ quote screen in detail (see illustration):
Edit Colours: Click on here and you will be taken through to a specific page where you can change the colours of backgrounds, font, flashes etc as well as alter font size etc. The click on any point on the colour charts(rainbow) below each customisable features to set the new colour.
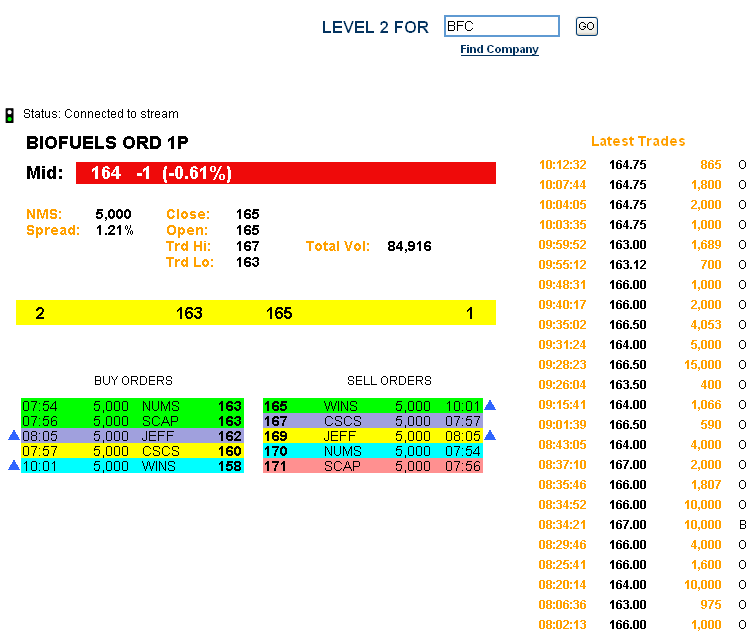
EPIC: BFC: Short-form code for stock.
Company Name: BIOFUELS
Mid 164 -1 (-0.61 %): Mid price is a simple average price between bid and offer i.e. 163 and 165. It has fallen 1p since it closed the previous trading day from 165 to 164.
NMS 5,000: This is the minimum number of shares that a market maker must make a firm price in. Investors can buy or sell fewer than this number of shares, in which case will definitely deal at the price quoted. Anyone wishing to deal in more than the NMS may have to accept less than the market price if they are selling, and pay more than the market price if they are buyer.
Spread: The percentage shown is the difference between the bid and ask price of 163.165 i.ee 2p which is a 1.21%% spread. The lower the spread the better.
Close 165: This stock.s mid price closed at 165 the previous trading day
Open: This stock.s mid price opened today at 165
Trd High 167: A trade has taken place today as at a high of 167
Trd Low 163: A trade has taken place today as at a low of 163
Latest Trades: these are the details of the last 25 trades that have occurred today

The Yellow Strip
The yellow strip indicates the best bid and offer prices available from the market makers. In this instance the best price a market maker will buy stock from you is at 163p and the best price a market maker will sell stock to you is at 165p The number 2 on the left side indicates the number of market makers(depth) quoting at 163p to buy stock from you, and on the right the 1 indicates just one market maker prepared to sell to you at 165p.

Buy orders: the price each market maker is prepared to buy stock from you at (you sell stock).
Sell orders: this is the price each market maker is prepared to sell stock to you at (you buy stock).
Time stamp: the last time each individual market maker changed their price in either an upward or downward direction.
Indicator Arrow: A blue arrow means the last price quoted by that market maker was in an upward direction, a red arrow indicates that the market maker moved his price down.
Size: this is the size that the market maker is prepared to deal in at the prices he is quoting.
Notice that in all cases they are prepared to deal at their prices quoted in a quantity of 5,000 shares which is the normal market size. On many stocks market makers will quote a larger size than NMS
Market makers' codes: this is a short-form code for each market maker: WINS = Winterfloods. NUMS = Numis. SCAP = Shore Capital etc
Market Makers Price: This is price that the market maker is quoting to deal. However every market maker is obliged by the London Stock Exchange to deal at 163/165 up to the normal market size. If you want to buy more then NMS then you may have to pay more!!!
The role of the market maker
A market maker runs a 'shop' and investors buy shares from him or sell them back to him. The rules for SEAQ stocks insist that all share transactions must go through a market maker.
The market makers act as retailers of shares and display their prices during working hours (8.00-4.30pm). The prices may vary (sometimes considerably) during the day, depending on a number of influences.
For example, if the holder of a very large amount of a share decides to sell (or many holders of small amounts), the market makers will reduce the price they are prepared to pay for the share. The converse is true also; if there is a consistent and large enough demand for a share, then the market makers will increase the price.
Market makers make money from buying shares at a lower price to which they sell them. This is the bid/offer spread. The more actively a share is traded, the more money a market maker makes.
It is often felt that the market makers manipulate the prices. However, 'market manipulation' is an emotive term that conjures up images of shady deals and exploitation. In fact, they are not elusive companies that appear then vanish overnight. They are duty bound to make a market and to meet the needs of those they are responsible to, so to this end they may try to influence the market.
However, market makers are known to lower prices to 'panic' investors into selling, sometimes called 'shaking the tree'. Moving the price up encourages sells, moving it down also encourages sells. The opposite is a 'dead cat bounce', a false mark-up to catch out all those bottom fishers or falling knife catchers.
One of the myths surrounding market makers is that they take positions in the stocks they quote, the usual cry is 'the market makers are shorting this stock; that's why the price is going down'. Wrong. Market makers make money by churning stocks, not by taking a position. This does not mean that they do not end up with an excess or a shortage of stock but the cost of holding and the risk of being the wrong side does not make commercial sense.
A market maker who is over-exposed to the market is injecting systematic risk to the whole market. If he was to take up many large positions across the whole range of shares he makes a market in, then any market crash would see him bankrupt (a la Nick Leeson and Barings) and therefore unable to make a market. Once the market vanishes, the shares become pretty worthless (if you cannot sell something at any price, what is it worth?). This, in turn, could force other market makers to go bankrupt and the whole thing would lead to a market meltdown.
Consider for one moment an analogy of market makers and bookmakers. They both make a 'book' and in many ways operate in the same fashion. Imagine standing in the betting ring at a racecourse. You look around all the bookings' stands and see the horse you want to back being offered at differing prices. You naturally go to they bookie who will offer you the best odds.
Let's say Fred is offering 15-1 on the horse you want to back, whereas the other bookie (Ted & Ned) is on 14-1 or further out. Fred will take your bet at 15-1 and will continue to take other bets until he feels he has taken on enough risk at that price. When his book is full, he will move his price down. Meanwhile, Ted & Ned notice that their prices are not bringing in the business, and move their prices up to equal Fred's, or indeed higher, to put themselves on the price. If a bookie takes on too much risk on any one horse, he will 'lay off' the bet among other bookies to share the risks. The whole business is a combination of simple demand/supply economics with a twist of risk.
Market makers work in exactly the same way, moving their prices to encourage buyers and detract sellers and vice versa. Likewise they can partially rebalance their books either by enticing trades by becoming ultra competitive or indeed 'laying off' by selling to another market maker direct.
Let's look at the SEAQ screen in a little detail:

In our example the current best bid price (buy order) is from KLWT, ABN, ETRA,GRAB and UBSW at 225p whereas all other market makers are quoting 220p or less. UBSW were the last to raise its price at 10:59 and must have been lower than 225p It generally points to the fact that UBSW had a buy order at that time which is filled and left it short of stock so it has raised its price to encourage someone to sell some stock to him.
Notice that, at the same time it moved its offer price up to 250p, putting it on the same price as most of the others. As market makers tend to follow a 'sheep' mentality, it would be unusual for UBSW to have left its quote unchanged for long so it should move up to 225/250p as well.
The spread or difference between bid (225p) and offer (250p) is 25p or 10%, so investors who buy at 250p would lose 25p plus stamp duty and the broker's commissions. So, in theory, for every share traded at these prices, a market maker will make a gross profit of 25p. If you drill down and look more carefully you will see that the current individual spread are generally 25p but WINS are 50p(220/270), KBCS 50p (200/250) etc.
Level 2 SETS Screen
SETS (stock exchange electronic trading system) is an electronic order-driven system for trading the UK blue chip stocks including FTSE 100 and FTSE Eurotop 300 stocks. The SETS order book matches buy and sell orders on a price/time priority. On SEAQ (the quotes system that we looked at in a previous article) all buys and sells go through a market maker who acts as an intermediary.
The basis of SETS is that it directly matches willing buyers and sellers, creating efficiency in the markets by doing away with the intermediary of the market maker. This efficiency is true while the SETS system is populated by the most liquid and heavily traded stocks, but if matched bargains operate on less liquid stocks, waiting for a buyer to match with a seller could take hours, days or weeks. Because of the efficiency of the SETS system stocks traded tend to have narrow spreads so the cost of entry and exit from a position is much smaller.
As an ordinary 'punter' should you wish to buy or sell a SETS stock, your broker will invariably still trade through a market maker, who will not display separate prices but simply use the SETS Level 2 screen to indicate where the market lies.

EPIC: VOD: Short form code for VODAPHONE
Company Name: VODAPHONE PLC
Mid 151.12 + 0.62 (+0.42%): Mid price is a simple average price between bid and offer i.e. 151 and 151.25. It has risen 0.62p since it closed the previous trading day from 150.5p which is a 0.42% increase.
NMS 200,000: This is the minimum number of shares that a market maker must make a firm price in. Investors can buy or sell fewer than this number of shares, in which case will definitely deal at the price quoted. Anyone wishing to deal in more than the NMS may have to accept less than the market price if they are selling, and pay more than the market price if they are buyer.
Spread: The percentage shown is the difference between the bid and ask price of 151 and 151.25 ie 0.25p which is a 0.17% spread. The lower the spread the better
Trd High 151.5: A trade has taken place today as at a high of 151.5
Trd Low 150.75: A trade has taken place today as at a low of 150.75
Latest Trades: these are the details of the last 25 trades that have occurred today .
Uncrossing: The uncrossing price of the auction (the mean price at which the bids and offers can be matched) is then taken as the closing price for the stock.
VWAP 151.02 - Volume Weighed Average Price: this is a running mean average benchmark especially used by institutions. Calculated by adding up the pence traded for every transaction (price times shares traded) and then divided by the total shares traded for the day. The theory is that if you buy at a price lower than the VWAP. it is a good trade. An example would be of stock that had only twice in a day ,say 10,000 shares at 200p and 10,000 at 215p., the VWAP would be 207.5p.
Total Vol 49,970,353: This is the accumulated total of all trades that have occurred so far today.
SETS Vol 37,547,026: This is the total traded so far today via the SETS system

Yellow Strip
Depth: The total number of limit orders on the buy side, at the best price of 151p, in this case 14. On the sell side of the yellow strip depth is 23.
Total: volume of the limit buy Orders at the current price of 151p now showing 6,274,036 shares.
On the yellow strip on the sell side there are 3,079,496 shares waiting to be sold at the best price of 151.25p.
Price: In this case 151p on the buy side which is the highest price someone is prepared to pay to buy stock. On the sell side this is 151.25p which is the lowest price someone is prepared to sell at.

Buy and sell orders: There are considerable number of order types in the markets but for the purposes of explaining SETS we need to deal with just the two main types.
1) Market Orders: A market order is an order to buy or sell a stock at the current market price - immediately. Unless you specify otherwise, your broker will enter your order as a market order. The advantage of a market order is you are almost always guaranteed your order will be executed (as long as there are willing buyers and sellers).
2) Limit Orders: To avoid buying stock at a price higher or selling a stock lower than you want, you need to place a limit order rather than a market order. A limit order is an order to buy or sell a security at a specific price. When you place a market order, you cannot control the price at which your order will be filled. The basis behind the SETS buy and sell quotes is that they are all limit orders placed in the system by individuals, companies or institutions. In the case of the buy quotes they are all willing buyers, but only at 151p or lower down to less than 40p; and on the sell quotes, willing sellers who wish to receive 15.25. or more all the way up to 1270p
Looking at the buy orders column, the 'top' order is someone who wishes to buy 1,223,738 shares but is only prepared to pay 151p. Below are others who do not want to pay that much. There is a 'joker' at the bottom(use scroll down button on live screens) who only wants to pay 35p. Fat chance, or maybe a chancer who will get lucky. In total there are 205 buy orders waiting to be filled with a total buy volume of 27,603,503 shares at an mean average price(VWAP) of 149.28.
On the opposite side of the book there are a total of 252 sellers waiting to be filled (buy/sell depth weighted towards the sellers), a total of 26,658,272 shares waiting to be sold.
Let's look at some examples and benefits of using the SETS level2 order book system. A normal broking client, let.s call him Martin, wants to buy 20,000 shares in VOD. His broker would either buy at 'market' from a market maker or, if he were a member of the central counterparty system, would buy the stock from the best available sell quote, who is Alan with 1,440,794 shares at 151.25p. Martin's broker will buy 20,000 off Alan and the screen changes to reflect the purchase and now shows the top quote as 1,420,794 shares at 151.25p.
Who is the clever one here? Simple, it's Alan, because he has received a good price for his stock, for which, if he had sold straight into the market he would only receive 151p, so he has now received a perceived premium of 0.25p. Not much on this stock but on many other SETS stock the gap is much wider!!
Looking at an opposite trade, say Stewart wanted to sell 30,000 shares. Again his broker could deal at 'market' with a market maker or he could place the trade through SETS. In this case he would sell 30,000 to the first limit buy quote at 151p (vol 1,223,738).
Again who is clever?
Stewart who sold at 151p or the buyers who bought off Stewart at 151p? The answer is the buyers have again done better.
So what should Martin and Stewart have done? They could simply have placed an 'advertisement' themselves in the limit order book(via their broker) either some way away from the current prices if they were patient or joined the top quotes themselves. Martin would put a limit buy order in at 151p and his order would have been entered just under the order for 698,982. Stewart meanwhile would put a sell order in at 151.25 and that would appear below the order for 350,000.
Limit orders are normally placed in the book on the basis that they are valid for today only unless a client specifies they are good until cancelled.
Sets Auction. The auction is on the MoneyAM screens are shown by a change in colour of the top limit orders and are marked with an MKT.
The auction process occurs regular at opening and closing of the markets and sometimes intraday auctions are called if a stock moves 5% or more in one trade.
The closing auction is for a five-minute period (random) from 16:30 to 16:35 after the close of normal business. In this period trading is suspended for five minutes and allows participants to submit orders to buy and sell at a stipulated price. Throughout this five-minute period, a theoretical 'uncrossing' price is calculated continuously and dynamically and displayed.
At the end of the five minute period, any orders that can be completed are matched up and executed at one specific price, the uncrossing price. The uncrossing price of the auction (the mean price at which the bids and offers can be matched) is then taken as the closing price for the stock.
The key difference between the auction period and normal trading is that participants can input orders to buy or sell 'at market'. This instruction can create short-term imbalances in liquidity that in turn forces stock prices up or down. Normally auction are used by Institutions to move large size orders of stock through the markets.
Level 2 SETSmm
A hybrid of SETS and SEAQ which works on the SETS electronic order book system but market makers display their prices on the combined screen

|


